Appearance
Insights & Analytics
Track your dealership performance, analyze deal trends, and monitor team productivity with DeskFlow Pro's comprehensive insights dashboard.
Overview
The Insights section provides powerful analytics to help you understand your F&I performance, identify trends, and make data-driven decisions for your dealership.
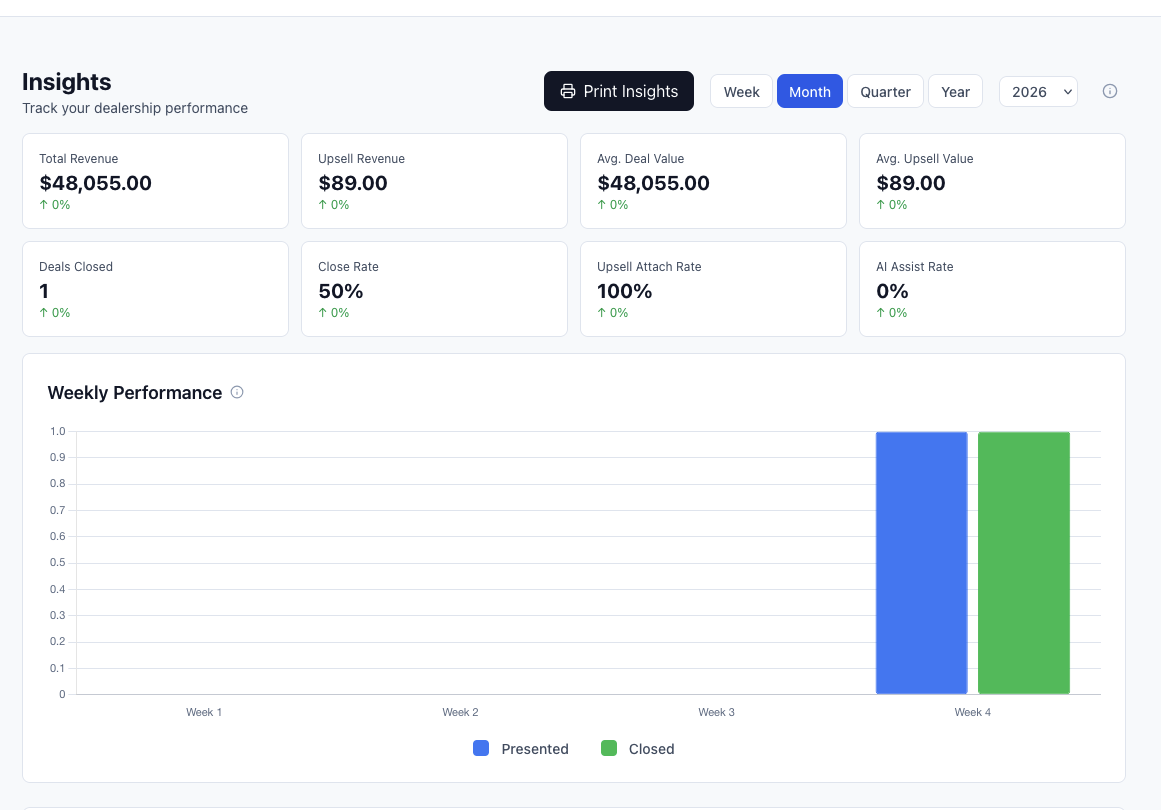
Key Metrics Dashboard
The main insights dashboard displays critical performance indicators:
Performance Overview
- Total Deals - Number of deals processed in the selected time period
- Acceptance Rate - Percentage of deals where customers accepted warranty packages
- Average Deal Value - Mean sale price across all deals
- Total Revenue - Combined revenue from all completed deals
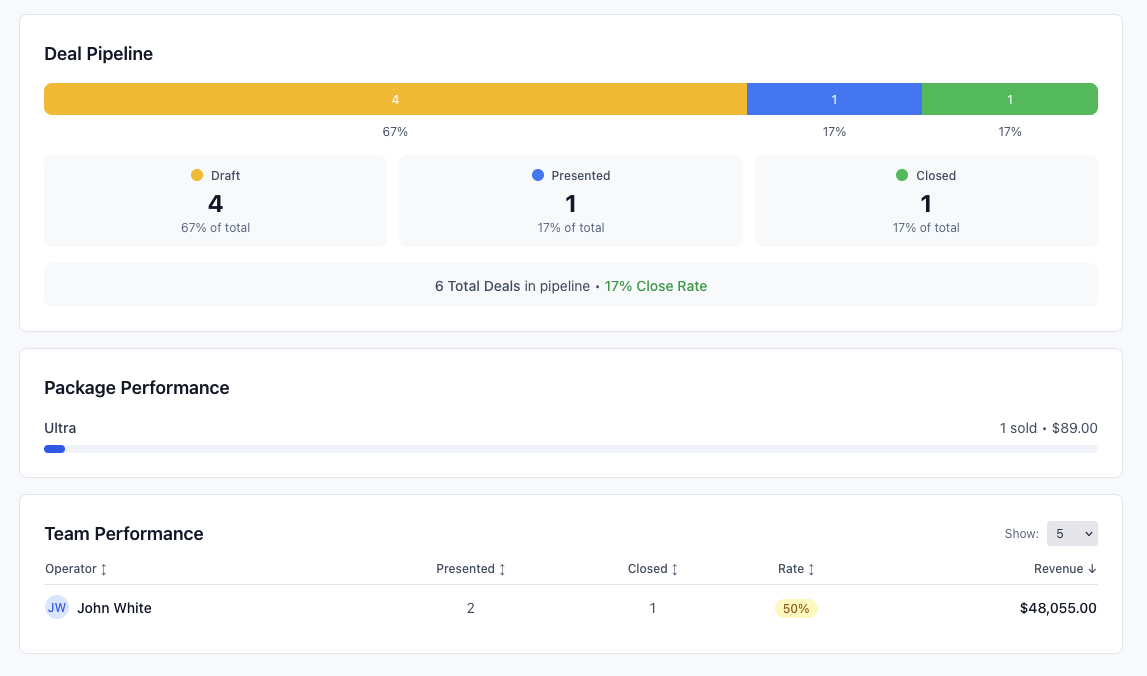
Deal Status Breakdown
- Active Deals - Currently in progress
- Presented Deals - Deals that have been shown to customers
- Closed Deals - Successfully completed transactions
- Draft Deals - Deals in preparation
Conversion Metrics
- Package Acceptance - Which warranty packages are most popular
- Operator Performance - Individual team member success rates
- Time to Close - Average time from deal creation to completion
- Customer Satisfaction - Based on deal completion rates
Detailed Analytics
Deal Performance Charts
- Revenue Trends - Track financial performance over time
- Deal Volume - Monitor deal creation and completion patterns
- Seasonal Analysis - Identify peak and slow periods
- Growth Metrics - Month-over-month and year-over-year comparisons
Team Performance
- Operator Leaderboard - Rank team members by key metrics
- Individual Statistics - Detailed performance for each team member
- Goal Tracking - Monitor progress against set targets
- Efficiency Metrics - Deals per day, time per deal, close rates
Package Analytics
- Package Popularity - Which warranty packages sell best
- Feature Performance - Most and least popular warranty features
- Pricing Analysis - Optimal pricing points for maximum acceptance
- Customer Preferences - Trends in customer selection patterns
Time Range Selection
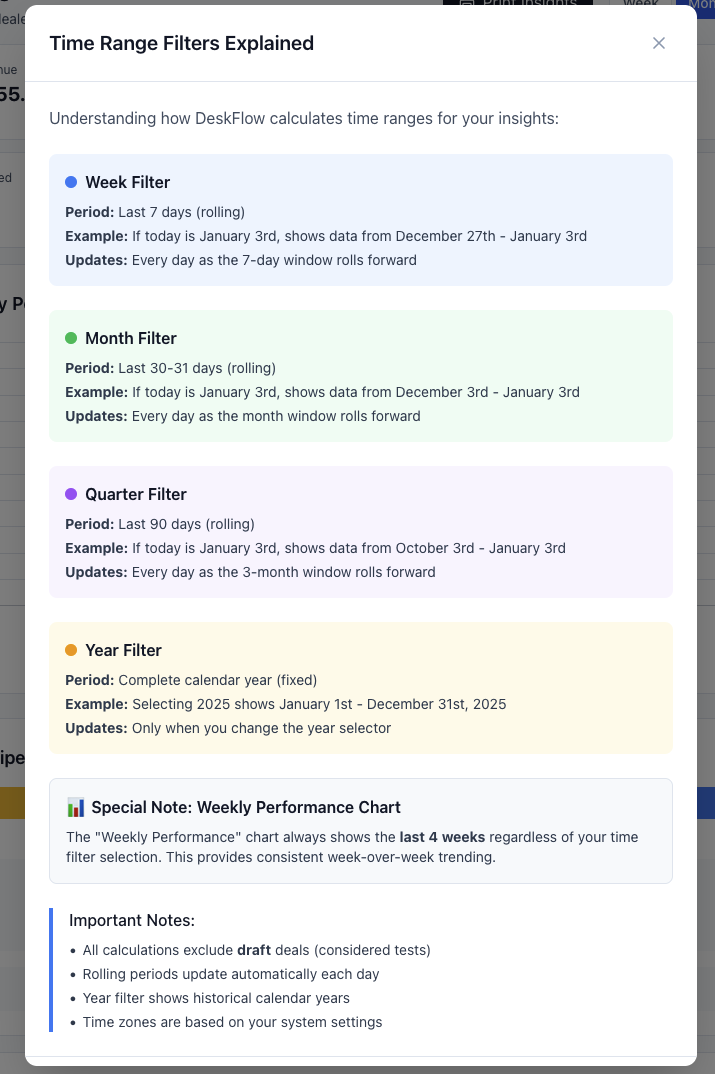
Analyze your data across different time periods:
Predefined Ranges
- Today - Current day performance
- Yesterday - Previous day comparison
- This Week - Current week to date
- Last Week - Previous complete week
- This Month - Current month performance
- Last Month - Previous complete month
- This Quarter - Current quarter results
- Last Quarter - Previous quarter comparison
- This Year - Year to date performance
- Last Year - Previous complete year
Custom Date Ranges
- Date Picker - Select specific start and end dates
- Comparison Mode - Compare two custom date ranges
- Rolling Periods - Last 30 days, 60 days, 90 days
- Fiscal Year - Align with your dealership's fiscal calendar
Performance Analysis
Use different time ranges to identify trends, seasonal patterns, and performance changes. Compare similar periods (e.g., this month vs. last month) for meaningful insights.
Reporting & Export
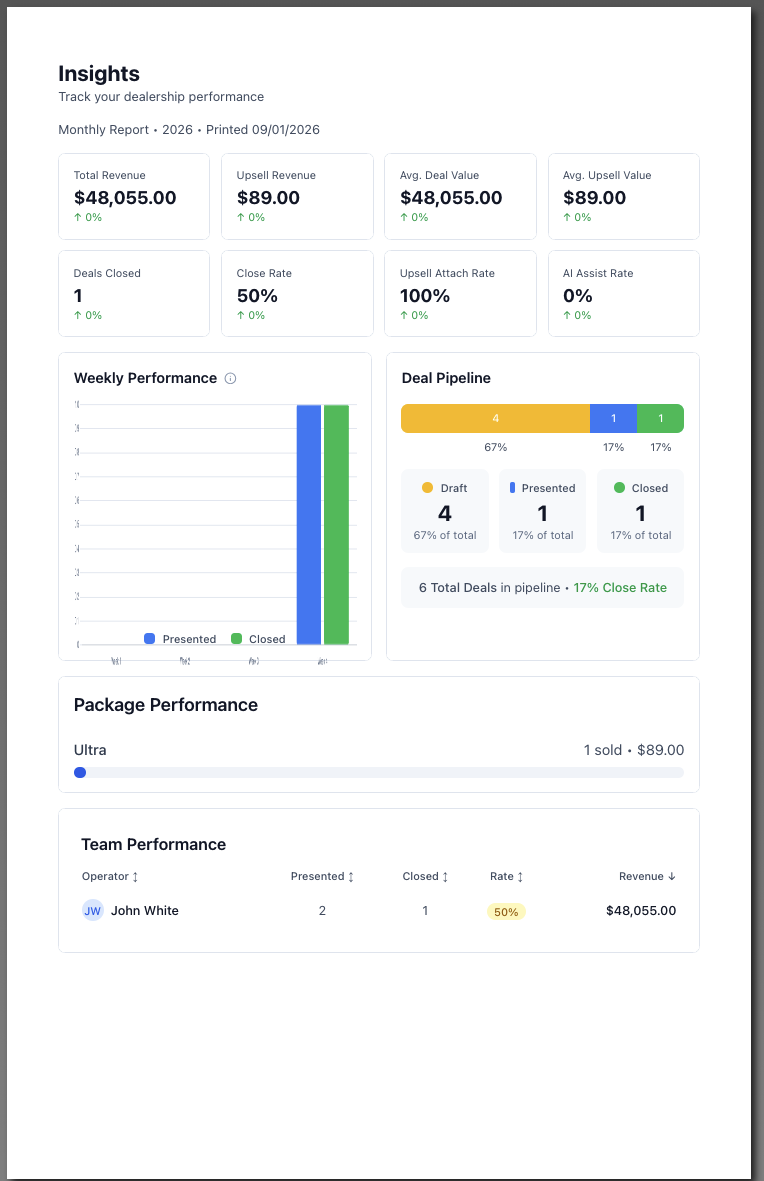
Generate professional reports for management and analysis:
Report Types
- Executive Summary - High-level performance overview
- Detailed Analytics - Comprehensive data breakdown
- Team Performance - Individual and group statistics
- Financial Reports - Revenue and profitability analysis
Export Options
- PDF Reports - Professional formatted documents
- Excel Exports - Raw data for further analysis
- Print Preview - Review before printing or saving
- Email Reports - Send directly to stakeholders
Scheduled Reports
- Daily Summaries - Automatic daily performance emails
- Weekly Reports - Comprehensive weekly analytics
- Monthly Reviews - Detailed monthly performance analysis
- Quarterly Reports - Strategic quarterly business reviews
Key Performance Indicators (KPIs)
Sales Metrics
- Deal Conversion Rate - Percentage of prospects who purchase
- Average Deal Size - Mean transaction value
- Deals Per Day - Daily deal creation rate
- Close Rate - Percentage of presented deals that close
Financial Metrics
- Revenue Per Deal - Average revenue generated per transaction
- Profit Margins - Markup on warranty packages
- Monthly Recurring Revenue - Consistent income streams
- Cost Per Acquisition - Investment per new customer
Operational Metrics
- Time to Present - Speed from deal creation to customer presentation
- Presentation Quality - Customer engagement and feedback
- Follow-up Efficiency - Response time to customer inquiries
- Documentation Speed - Time to complete paperwork
Customer Metrics
- Satisfaction Scores - Based on deal completion and feedback
- Repeat Customers - Return rate for additional services
- Referral Rate - Customer-driven new business
- Complaint Resolution - Speed and effectiveness of issue handling
Using Insights for Business Decisions
Performance Optimization
- Identify Top Performers - Learn from successful team members
- Package Optimization - Adjust offerings based on acceptance rates
- Pricing Strategy - Find optimal price points for maximum conversion
- Training Needs - Identify areas where team members need support
Strategic Planning
- Capacity Planning - Understand peak periods and staffing needs
- Inventory Management - Align warranty offerings with demand
- Goal Setting - Use historical data to set realistic targets
- Market Analysis - Understand customer preferences and trends
Operational Improvements
- Process Efficiency - Identify bottlenecks in deal flow
- Technology Adoption - Monitor how new features impact performance
- Customer Experience - Optimize presentation and closing processes
- Quality Control - Maintain consistency across all deals
Manager vs Operator Access
Manager Access
- Full dealership insights - Complete view of all metrics
- Team performance - Individual and comparative analytics
- Financial data - Revenue, profit, and cost information
- Strategic reports - Long-term trends and planning data
Operator Access
- Personal performance - Individual metrics and goals
- Own deal history - Personal deal analytics only
- Limited comparisons - Anonymous benchmarks without team details
- Personal targets - Individual goal tracking and progress
Data Privacy
Operators can only view their own performance data to maintain privacy and healthy competition within the team.
Best Practices
Daily Monitoring
- Check key metrics each morning to understand current performance
- Monitor active deals to identify opportunities for follow-up
- Review team activity to provide support where needed
- Track goal progress to stay on target for monthly objectives
Weekly Analysis
- Analyze trends to identify patterns in performance
- Review team performance to recognize achievements and address challenges
- Evaluate package performance to optimize offerings
- Plan for upcoming week based on insights and trends
Monthly Reviews
- Generate comprehensive reports for management review
- Set goals for next month based on historical performance
- Identify training opportunities to improve team performance
- Evaluate strategic initiatives and their impact on results
The Insights dashboard in DeskFlow Pro provides the data you need to make informed decisions, optimize performance, and drive dealership growth through effective F&I operations.